Hi Jerrry,
I using the GdalRasterWarp() to creat a new DEM grid with a new cell size (from 30 to 10 meters) and I got strange results.
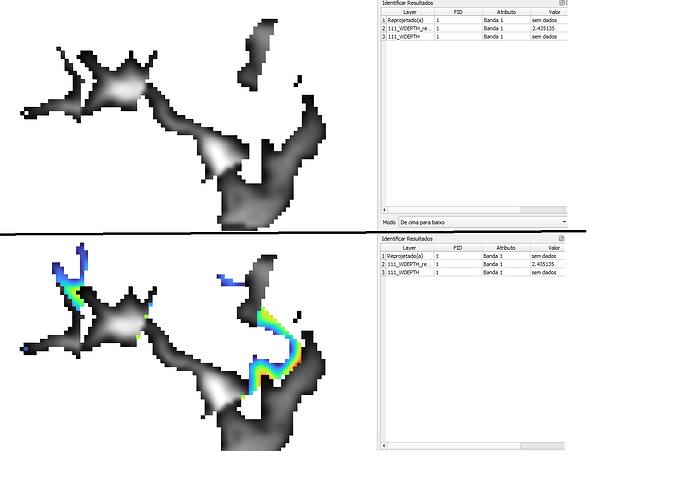
In the picture the gray area is the input grid and the colored area is the area added with strange values. In the top figure is the output grid from QGIS and the bottom is tha result from MW.
Looking the results we can see the map resulting after call this function create a new area where must have NODATA value, but it create a area interpolated (colored area).
I called the function with a input grid with WGS84 projection and using 3 tests parameters to compare:
-of GTiff -tr 0.00009 0.00009 -r cubic
and
-of GTiff -tr 0.00009 0.00009 -r cubicspline
and
-of GTiff -tr 0.00009 0.00009 -r cubicspline -srcnodata -32768
All the resulting maps have the same area strange if comparared with QGIS usinga the same GDAL WARP function.
I looked the MW source code and I can’t explain what is happening.
Plense, can anyone help me.
